close

Bi-Directional Cross Filter in Power BI

The CROSSFILTER function determines the direction of cross-filtering to be utilized in a calculation for a two-column relationship. This function leverages existing relationships in the model to specify the cross-filtering direction for the indicated relationship, distinguishing relationships by their ending point columns. When necessary, this filter is applied through the relationships in the many-to-one manner, which […]

Cross Filter in Power BI

The CROSSFILTER function determines the direction of cross-filtering to be utilized in a calculation for a two-column relationship.

This function leverages existing relationships in the model to specify the cross-filtering direction for the indicated relationship, distinguishing relationships by their ending point columns. When necessary, this filter is applied through the relationships in the many-to-one manner, which is a highly effective and sensible technique.

What does Cross Filter Direction mean in Power BI?

In comparison to other database management systems, Power BI’s relationships are a little different. The majority of systems only have a relationship and there is no particular Direction for it. Nevertheless in Power BI the relationship has a direction. Cross filter direction in Power BI has a big impact on how filtering works.

What is Bidirectional Cross Filtering in Power BI?

Report writers and data modelers now have more control over how they apply filters while dealing with related tables, owing to bidirectional cross-filtering. They can apply filters on both sides of a table relationship using bidirectional cross-filtering. By spreading the filter context to a second related table on the other side of a table relationship, developers can apply the filters.

Benefits of Bidirectional Cross Filtering

The bidirectional cross-filtering tool in Power BI is popular among creators. It surely comes with a slew of advantages.

  • You get computations from both sides of a table relationship when you apply filters to both sides. This, of course, means you’ll have more responses, which means you won’t miss out on crucial information that could lead to significant business decisions. Left-to-right linkages aren’t always enough to satisfy a modeler’s needs. It’s sometimes necessary to examine how a relationship functions in the opposite direction. You can cover more of your data needs with bidirectional cross-filtering.
  • You can develop and deliver more detailed reports as a result of the additional information you’ll acquire from bidirectional cross-filtering. This way, you’re not the only one who gains from the additional knowledge. Your end-users will also be able to avoid losing out on key information, resulting in superior overall insights. Finally, more granular data can help you make better overall decisions for certain divisions or your entire company.
  • You also don’t have to conduct the difficult math yourself because the bidirectional cross-filtering capability is already incorporated into the Power BI solution. You also won’t have to employ complicated DAX formulas, which are useful but time-consuming in these circumstances. You can just use the relevant filters right away.

Ultimately, the benefits of bidirectional cross-filtering are as diverse as the modelers who use them. The more you familiarize yourself with your options, the more confident you’ll be when you apply them to your reports.

Challenges of Bidirectional Cross Filtering

The most difficult challenge of bidirectional cross-filtering is how it affects the overall performance of Power BI. The option puts the application under a little more pressure than single-direction filtering. As a consequence, excessive bidirectional cross-filtering can cause Power BI to slow down.

Users can use it as needed, but they should try and avoid making it their default. This way, the performance would be much more efficient and hassle-free. 

The existing filtering options in Power BI are intended to be balanced. All the options that a user needs are right there, but the default settings ensure that Power BI runs well.

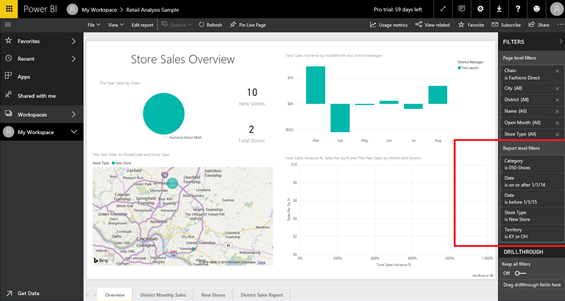
How to Enable bidirectional cross-filtering for DirectQuery?

Cross-filtering can be enabled from the edit relationship dialog box. The following settings must be configured to enable cross-filtering for a relationship:

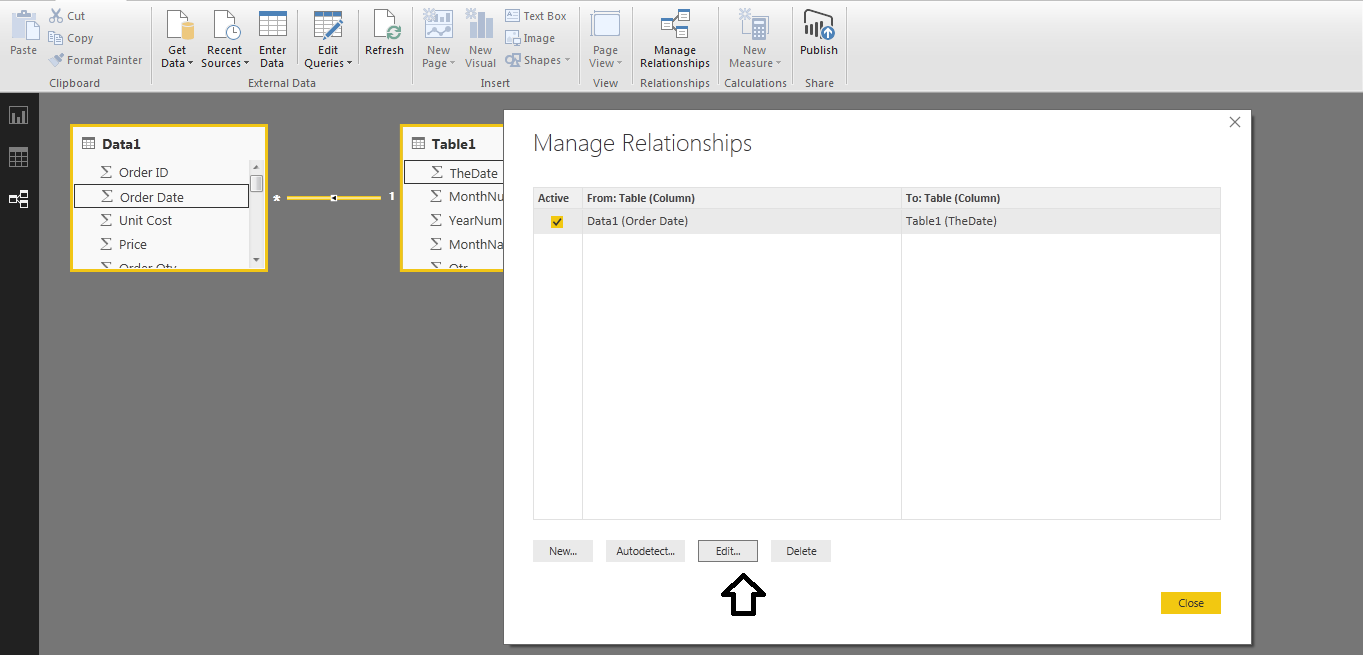
Go to Manage Relationship menu under Modeling tab as below – 

Manage Relationship Option

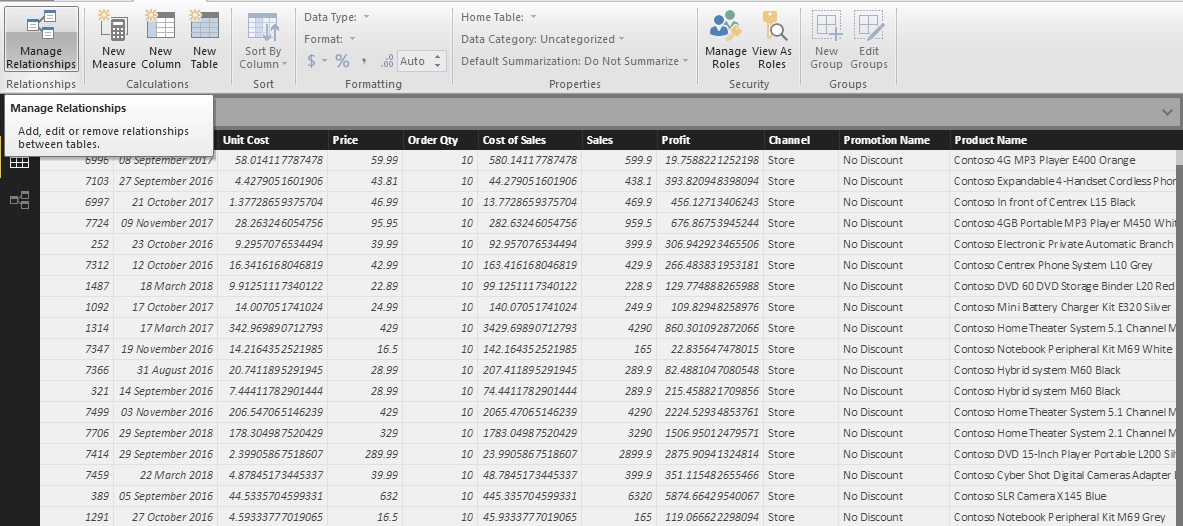
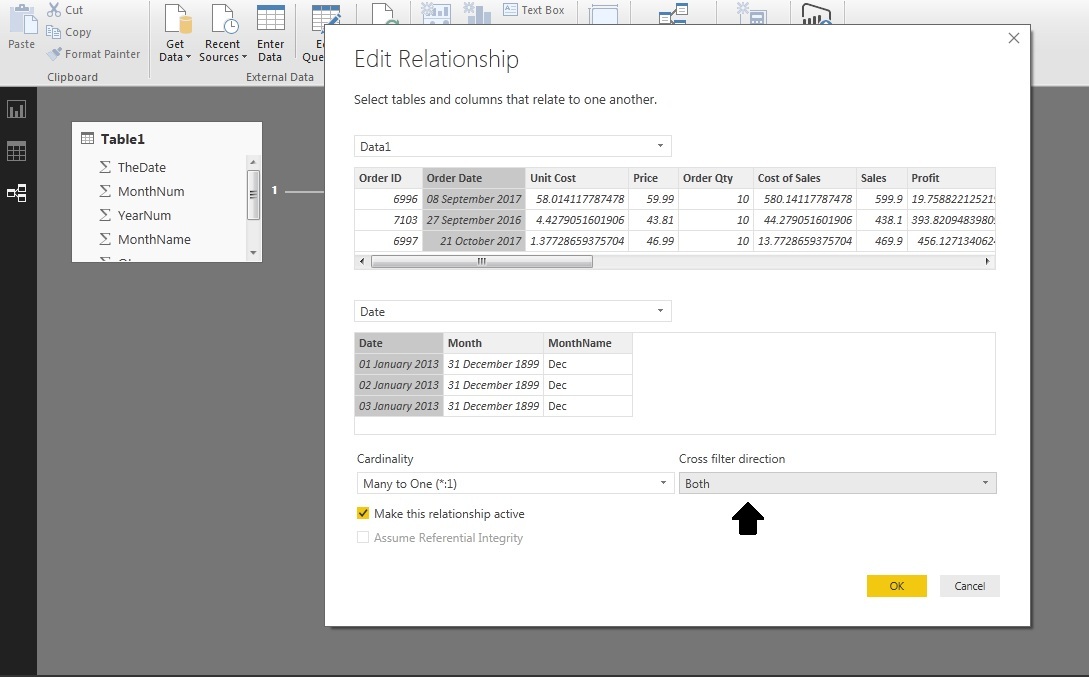
Then Select Edit under Manage relationship dialog box as shown below – 

edit relationship option

Set the direction of the cross filter to both. Choose both orientations to apply the security filter – 

Bidirectional Filter in Power BI

What is the default visual interaction in Power BI?

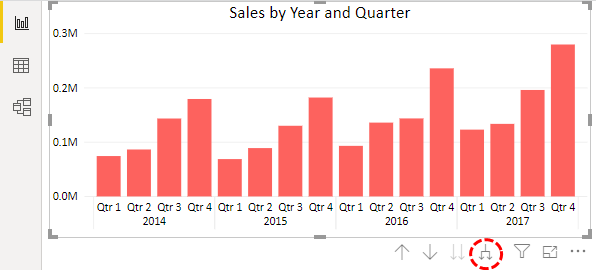
Drill Mode On should be the default visual interaction in Power BI; you can turn it off, but if you leave it off, you will have to alter it every time. Set the Default to ‘Drill Mode On‘ instead.

Drill Mode indicates that if the totals are at the yearly level, then this mode can allow the user to drill down to monthly, weekly, daily, and so on. Drilling down to a certain level is only feasible because of the data.

How to change default visual settings in Power BI?

Step 1: Choose a visualization to activate it.

Step 2: Display the visual interaction options.

Select the dropdown from the report menu bar in the Power BI service.

Select Format > Interactions from the Desktop menu.

Then choose edit interactions. All of the other visualizations on the report page get cross-filtered and cross-highlighted icons from Power BI.

Drilling Filters and other visualizations can now be selected. When you drill down or roll up in a visualization (Drill down and up), the modifications will now match the current drilling selection.

Types of interactions in Power BI

Drill down, roll up, filter, highlight, and no impact are the options.

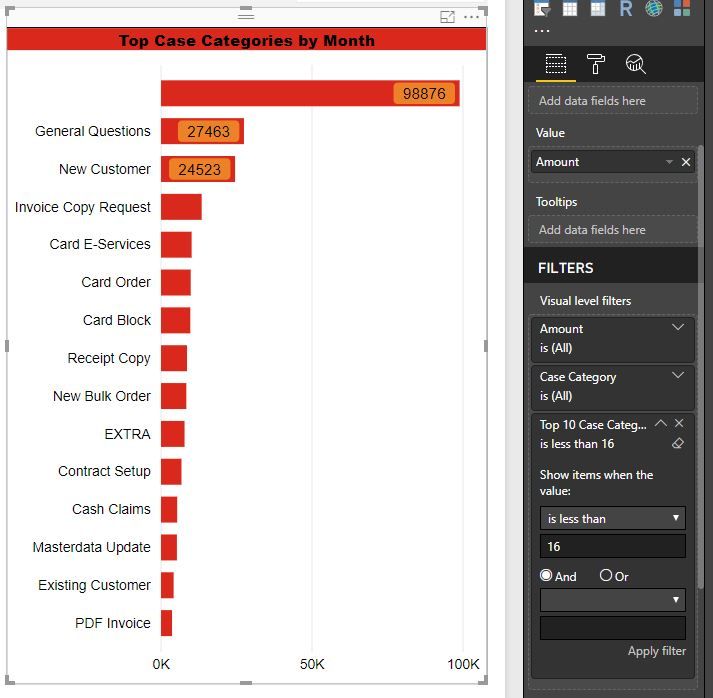
CROSS-FILTER function in Power BI –  

Example: Let’s say there is a report which lists out the products a company sells and where they were sold. For each sale, they have the shopping center where it occurred. Obviously, a single product can have been sold in many different centers. For each product, they would like to know how many centers it is being sold in:

Use of Cross-filtering – 

Step One: Set the Cross-filter direction to both, it will allow the Purchase table to filter the Centre table.  This should make the count of centers for each product correct.

Step Two: Create two slicers, one containing the Product Names and one containing the Centre Names. 

What happens when you try filtering the table using the Product Name slicer?

Some of the Centre Names will vanish.

Using a DAX measure to change cross-filtering temporarily

In the relationship view switch the filtering back to single – 

  1. Filtering by center should change which products you see but changing the products shouldn’t impact the centers displayed: i.e., the relationship should be one-way only. This can be done by creating a measure that mimics the effects of this change:
  2. You can use the CALCULATE function to change the filter context for a calculation (such as the relationship between two tables).
  3. CROSSFILTER takes in the columns from each table used to join the tables together and lets the users indicate the direction of filtering allowed.
  4. The measure will show the number of stores for each product as if both relationships existed, while the count shows the relationship doesn’t exist. All center names will be shown now.

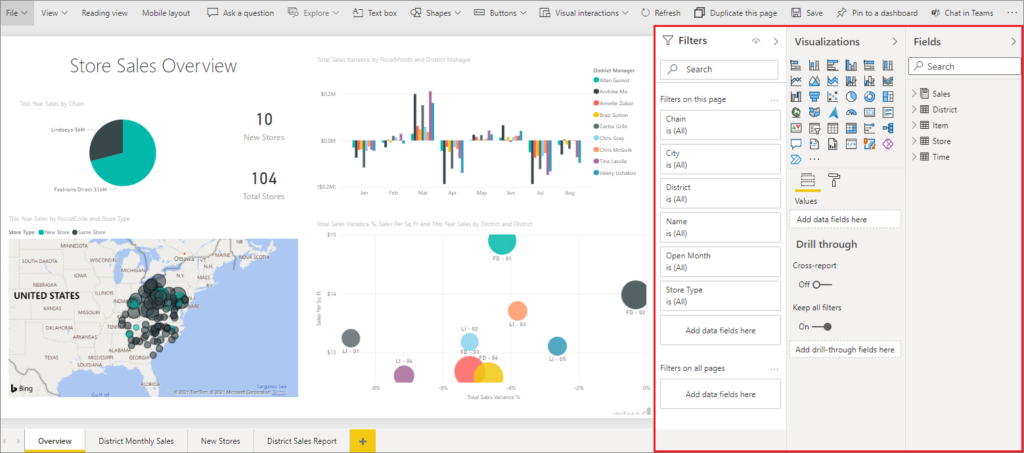
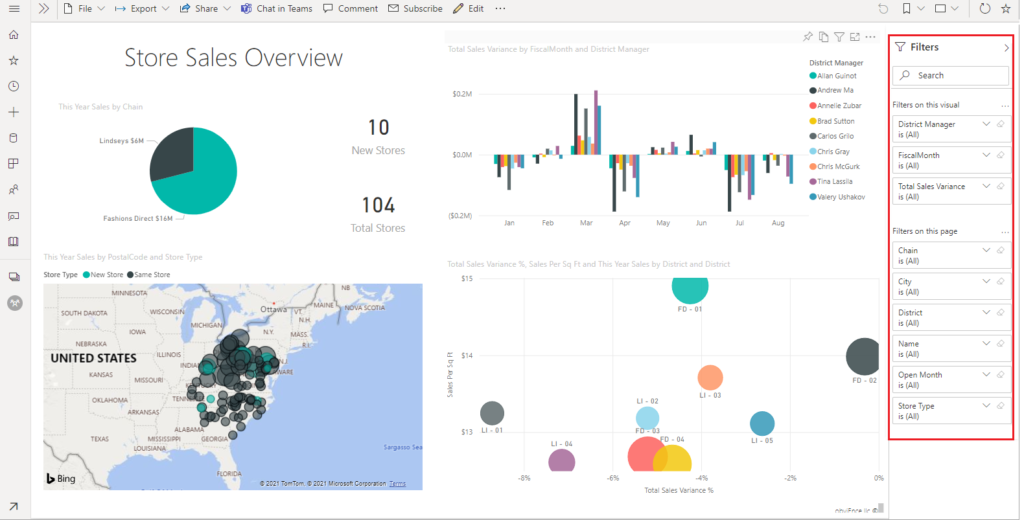
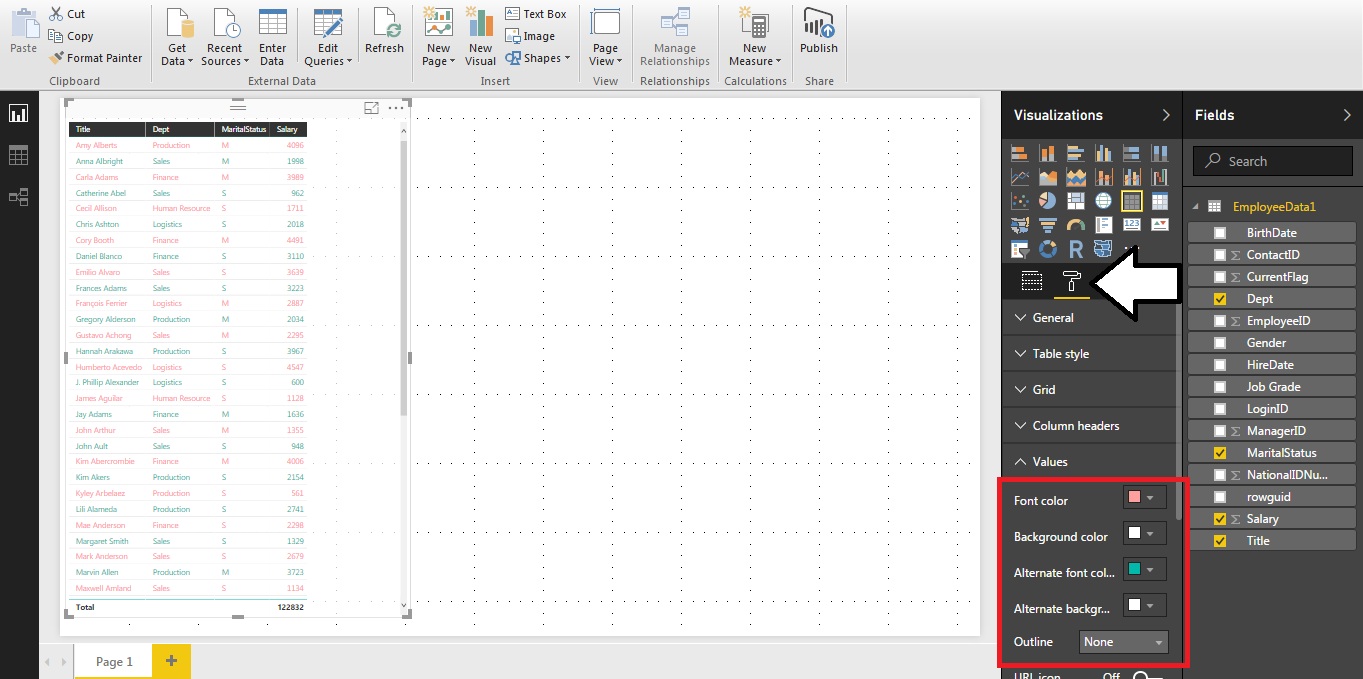
Control Cross Filtering of Charts in Power BI

Create a Power BI report with at least two chart objects first. Then take the following steps:

  1. Select the new Edit button under “Visual Interactions” from the drop-down menu.
  2. Pick one of the graphs.
  3. A set of three icons will appear next to all other charts on the page.
  4. If you pick the pie chart icon, the original chart will be visually filtered using shading to show the new share – this was the default behavior.
  5. When you click the filter button, the entire chart is refreshed for the subset of data you selected.

The chart will not filter if you select the Ghostbusters emblem. After you’ve chosen the desired behavior, click the Edit button again, and the icons will vanish.

Every single chart on your canvas can have its cross-filter behavior adjusted precisely how you want it for cross-filtering from other charts — complete granular control.

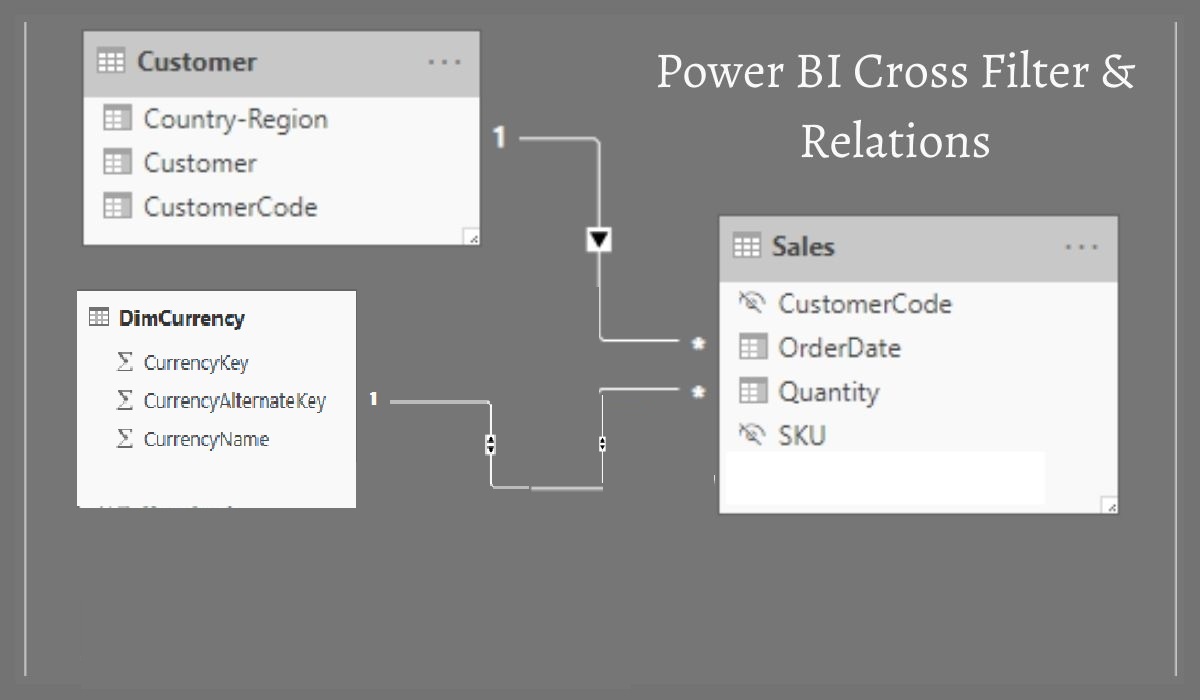
Optimizing cross-filtering performance using aggregate awareness

The filtering options for single-direction filtering operate on the table where we’re aggregating values. There could be more than one route for fields to pass across tables with bi-directional filtering. When generating visualizations that use fields from different tables, this ambiguity can mislead Power BI and lead to problems.

However, with a star schema model like this, bi-directional filtering is entirely safe for our relationships. Determining the proper table associations can have an impact on how your data model functions. Aggregate awareness allows data teams to restrict the amount of data queried while also avoiding the hazards of data extraction, which can be quite uncomfortable for analytic teams.

Cross filtering in Power BI: Recommended or not?

When you execute cross-filtering, there is always a performance hit, so users should only do it when it is really necessary. Cross-filtering is believed to be one of the top Power BI performance killers since Power BI has to really work hard with it.

Conclusion

Finally, Cross Filter is a useful function for shifting the direction of a relationship. Instead of changing the relationship’s direction, this method can be adopted. However, before you begin, consider power bi modeling cross filter direction best practices.

Frequently Asked Questions – 

1.How do visuals cross filter each other in a Power BI report?

 – Choosing a data point in one visual on a report page will automatically cross-filter or highlight the other visuals on the page. The report designer determines how the visuals on a page interact. Designers may toggle visual interactions on and off, as well as adjust the default behavior for cross-filtering, and drilling.

2.How do you link two filters in Power bi?

– To connect to the data source and import it into your model, you’ll need to utilize Excel or Power BI Desktop. You can either construct a calculated column or measure as part of your Excel or Power BI Desktop data model, or you can build a calculated column or measure as part of the query using “M” code.

CALCULATE is defined as CALCULATE (<expression>, <filter1>,<filter2>…). This implies you can apply many filters simultaneously. Multiple filters, on the other hand, will act in coordination. In other words, the data would have to satisfy both requirements.

Understanding Different Types of Filters in Power BI

  Filters in Power BI sorts information and data based on a bunch of parameters. Users can pick and choose particular fields or values within fields to only see the information that pertains to them. With so much level of filtering option available, a newbie Power BI learner could easily get confuse about the types […]

Filters in Power BI

 
Filters in Power BI sorts information and data based on a bunch of parameters. Users can pick and choose particular fields or values within fields to only see the information that pertains to them. With so much level of filtering option available, a newbie Power BI learner could easily get confuse about the types of filter in Power BI.
 

Types of Filters in Power BI

report level filter power bi

 report level filter img source: docs.microsoft.com

Report-level Filters: Filters that influence all of the data in a report, irrespective of what you’re having a look at, are called report-level filters. Think of them as universal filters. For example, if your report has ten pages, you can use the report level filter to filter each of those ten pages individually.
 
Page-level filters: These filters are handy for designing pages that focus on certain subsets of your data because they only filter the data on that certain page.
 
page level filter power bi

page level filter image source: docs.microsoft.com

For example, you can use page-level filters to make one-page focus entirely on income data, while the following page focuses solely on spending data. Page-level filters work inside the framework of report-level filters, which means they can’t be used to negate a report-level filter.
 

Visual-level filters: These filters only affect the data on a single visual, such as a table, graph, card, slicer, or other visual. These are by far the most comprehensive filters you can apply to your data, and they work in conjunction with both page-level and report-level filters, so visual-level filters can’t just ignore them, and they can’t be used to filter data on other visuals.

visual level filter

img source: powerbi.microsoft.com

For example, with visual-level filters, you can present a pie chart of newcomers versus returning users in your most important markets with a filter that includes Country IN “United States, Canada, Mexico, Japan.”
 

Drill-down filters: These filters are automatically added to the filter pane when users leverage the drill-down functionality for a visual in your report. If you can modify a report, you can also change or remove the filter in the pane.

drill down power bi

drill down img source: WallStreetMojo.com

For example, If you want to give manufacturers drill-through. In this example, a drill-through page with visuals showing overall sales, total number of units shipped, sales by category, sales by region, and so on may be created. When you go to that website, the visuals will be tailored to the manufacturer you chose.
 

What is Cross filtering?

Cross filtering: This feature of Power BI removes all the data except the data that you want to focus on. To put it simply, this feature will redraw the chart in terms of the applied filter.
 

Using Filters in Power BI: Visual, Page, Report

Add a filter to a visual

There are two types of filters for visuals. There are two techniques to apply a visual-level filter to a visual.

  • The fields of a visual act as filters for that visual automatically.
  • You can find a field that isn’t already visual and add it to the Visual level filters bucket manually.

Filter using a field that isn’t visible:

  1. Choose Edit in the Power BI service to access your report in the Editing view.
  2. If they aren’t already open, open the Visualizations, Filters, and Fields windows.
  3. To make a visual active, select it.
  4. Choose the field you wish to add as a new visual-level filter from the fields pane and move it to the filters on this visual area.
  5. Use the filter and you’re done.

Report readers can engage with the category filter in reading view, choosing or removing values, if you save your report with this filter.
 

Add a filter to an entire page

A page-level filter can similarly be used to filter an entire page. Here’s how:

  1. Open the Retail Analysis report in Power BI, then proceed to the District Monthly Sales page.
  2. Select Edit to bring up the editing view of your report.
  3. If they aren’t already open, open the Visualizations, Filters, and Fields windows.
  4. Choose the field you wish to use as a new page-level filter from the Fields pane and move it to the bottom of the Filters on this page section.
  5. Choose either Basic or Advanced filtering options for the values you want to filter.
  6. To reflect the update, all of the visualizations on the page will be redrawn.


Add a filter an entire report

  1. Select Edit to access the report in the Editing view.
  2. If they aren’t already open, open the Visualizations and Filters window and the Fields pane.
  3. Choose the field you wish to use as a new report-level filter from the Fields pane and slide it into the Report level filters section.
  4. Choose the values you’d like to filter.
  5. To come back to the previous report page, select the back icon.

The visualizations on the current page, as well as all of the report’s pages, are updated to match the new filter.
 

Filtering certain values in Power BI:

To filter certain values in Power BI here is what you can do:

  • First, right-click a particular cell in a column to open the shortcut menu for a specific value.
  • Point to the small filter icon.

filtering a value in cell

img source: docs.microsoft.com

  • Next, select the filter option you want to use.


Modes of Filters: Basic and Advanced

There are two modes of filtering in Power BI: Basic and Advanced Filtering.
 

1. Basic Filtering

It provides you with a searchable and extendable list. You just have to insert a term or identifier into the search box to look for a value. In return, the list of available values is immediately updated based on the search keywords you entered.

basic filter in power bi
 

2. Advanced Filtering:

Advanced Filtering provides you with more precise control over what you want to filter out. Based on the type of columns, advanced filtering capabilities vary.

advance filter in power bi
 

Adding a Filter Pane to Existing Report:

  • Open an existing report and then go to File tab> Options & settings> Options to add the filter pane.
  • Then, choose Report options.
  • SelectEnable the updated filtering pane and show filters in the visual header for this report in the Filtering experience section.
  • Click the OK button.
  • On the right side of the report editor, a new filter window will appear.
  • Drag and drop the field on the relevant column in the filter pane to apply filtering conditions to the visual/page/report.


Integrating charts with Filters and Slicers:

If you need filters but they’re not essential to your visualization and keeping selections isn’t a priority, try cross-filtering core visuals. Cross filtering can be done with almost any core visual. The Table or Matrix visual with Data Bars activated in conditional formatting is a smart approach to enhance a dense visual for highlighting data while also promoting interaction and cross-filtering.
 

Formatting Filter Pane:

You can format the Filters pane to match the appearance and flow of your report, which is a key part of the filter experience. The Filters pane can also be formatted individually for each page of the report. You can format the following elements:

Filter Pane formatting in Power BI
 

  • Color of the background
  • Transparency of the background
  • Border on or off
  • Border color
  • Font, color, and size of title and header


Adding filter in Power BI workspace:

filter in power bi service
 

  • Open the web version of your Power BI workspace.
  • And then choose a report that has already been uploaded.
  • When the report opens, you’ll notice a Filters pane on the right, where you can examine the filters that are currently applied to the report or to a specific visualization.

 
Adding Filter in Edit Report Mode:

  • To deploy new filters on the report, head on to the Edit report option.
  • Drag and drop your preferred fields into the Page level filters or Report level filters column.
  • Choose the values that will be used to categorize the report’s data. The report’s visualizations will change automatically based on the filters that have been applied.

 
Editing filter in edit report mode:

  • Edit your report.
  • Select the filter-enabled chart or control. Alternatively, you can use the page settings.
  • In the Properties panel, go to the Data tab.

Make the desired adjustments by clicking the Edit icon.
 

Power BI Slicer vs Filter:

Even though Slicer & Filter have little similarity in terms of segmenting or filtering the data, but there are big differences when it comes to Slicer vs Filter in Power BI.
 
What are Slicers?
A slicer is a dimensional column that refines the data on the canvas. The users choose a value from a list to “slice” the data. Slicers can do two things: 
 
They can be added to the canvas using the visualization panel. Second, because they are visualizations, when you refresh the dashboard, the data behind the visualization will be changed, which may have performance concerns.
 

What are Filters?
Filters also refine the data, but they’re intended to be used by developers to customize the dashboard’s visualizations before it’s made available to users. Visual level filters, page-level filters, and filters that apply to all pages are among the three types of filters that can be configured using the Filter’s panel to the right side of the canvas.
 

Conclusion:
Filters in Power BI are strong capabilities that allow you to filter data at any level. And the best part of the Power BI filters is that you can apply all of the filters at the same time. When it comes to designing for interactions, Power BI gives report designers a lot of possibilities. It’s critical to consider how your audience will utilize the report and to learn about the company’s goals and situations.

Microsoft Power BI – The Best Business Intelligence Tool

Microsoft Power BI has simplified the world of business intelligence with its efficient, intelligent, and scalable Data Visualization tool.

Make-the-Right-Start

Microsoft Power BI has simplified the world of business intelligence with its efficient, intelligent, and scalable Data Visualization tool. This business data analytics tool from Microsoft finds, gathers, and stores data from multiple data points, be it a spreadsheet on a network computer or a cloud app. Businesses use this data for visual analysis, to gather insights, and make informed decisions.
The beauty of Power BI lies in its simplicity and speed. It is simple, fast, robust, and enterprise-grade. Moreover, anyone can use the tool – even a novice having no technical knowledge.
What Makes Power BI More Intelligent
The three elements that make the Microsoft Power BI smart and robust are,
• Power BI Desktop (Windows Desktop Application),
• Power BI Service (Online SaaS Service), and
• Power BI Mobile Apps (Windows, Android, and iOS).
Apart from these three elements, there is a fourth one. Power BI Report Server – used to publish Power BI reports to an on-premise report server after creating them using Power BI Desktop.
Major Strengths of Microsoft Power BI
• It supports a hybrid deployment model. It unifies; numerous data collection points create subsets through Quick Insight Feature and applies data analytics applications to the compiled data to retrieve information.
• Power Query makes it seamless to integrate and transform data into Power BI web services. Later, it shares the data with numerous users and models for better visualization.
• Liberty to use extensible database construction (Schemas) through a usual data model.
• Flexibility to customize the appearance, visualization, and design of the reports and charts. As per your needs, import new tools or change the appearance of existing data visualization tools.
• Build custom pictograms with simplified bar charts, column charts, and lists using Infographic Designer. If required, alter the size, and fill the icons percentage with colorful uncomplicated graphics and neat features.
• If needed, integrate the Microsoft Power BI dashboard in your preferred software product using the available API.
• Break down complex data models into individual diagrams with the use of modeling view. Set, view, or modify common properties as per your needs.
• It offers digital assistance like querying data verbally using natural language. The ‘Cortana Integration’ on mobile devices makes it more powerful.
How Power BI works?
Your role within a team or project determines what Microsoft Power BI elements you will be using or exploring.
For example, a business analyst extensively uses Power BI Desktop for creating reports and publishing them on the Power BI service for you to view. A salesperson prefers using the Power BI phone app. He uses it to fill new sales leads and monitor the progress of those leads. Different people use contrasting elements of Microsoft Power BI as per their motive and according to their needs.
However, here are the two steps summarizing the working pattern of Microsoft power BI
• Step# 1:
o The Business Intelligence tool from Microsoft connects to all the data points and starts building reports in the Power BI Desktop.
• Step #2:
o The reports, created in Power BI desktop are published on Power BI Service and shared with end-users in Service, Mobile Apps, for viewing, analysis, and actionable purposes.
What Makes Power BI Unique
One of the Gartner studies published in 2019 predicts that the BI market will reach 20 billion USD. They say that a steep growth will occur from 2020-2025.
If you want your organization to become agile, future-proof, and ready for tomorrow, Power BI is the perfect BI system to get actionable insights from the raw data.
The two factors that make Microsoft Power BI unique are,
Azure Database:
Many businesses are using Microsoft Azure cloud solutions for data warehousing. Power BI is a boon to them – empowered to monitor the Azure environment more effectively.
Many organizations use Microsoft Azure for pushing large amounts of data into the cloud. Once done, they opt for a Modern Data warehouse-like Microsoft Azure Synapse to leverage endless possibilities.
Past, Present, and Future:
Advanced data modeling in Power BI ensures accurate predictive analytics that forecasts trends, features for exploring future outcomes reliably.
The powerful combination of analytics and forecasting tools in Microsoft Power BI enables users to compare numerous ‘What If’ scenarios by adding an intended forecast (Finance, Sales, Industry) in your line chart without writing a single line of code.
The modern-day software has a built-in predictive forecasting feature that finds relevancy in seasonality and next reporting time to provide the forecasting outcome. The advanced models are self-learners, it learns using historical data in lieu with the statistical algorithms backed by data mining or Machine Learning capability. Together it visualizes past trends, optimizes present performance, and acts to align future predictions.
Conclusion
When it comes to BI tools and services, there are a plethora of options in the market. You can pick anyone of your choices that will help you gather, organize, and scrutinize data effectively to share information across users and support informed precise, and reliable results. Microsoft Power BI is one such tool that has emerged as a leader in the Business Intelligence domain. With significant cost savings, increased productivity, and extensive Data analytics capabilities.
Forget every other tool – just go for Power BI and nothing else.
We are the trusted, reliable, and certified Microsoft partners for Power BI Consulting. Our Power BI experts will handle all your queries and help you in any manner to get you running.
Call our Power BI experts now!

Top 10 Benefits of Choosing Microsoft Power BI as Preferred Data Analytics Tool in 2021

Today we live in a data culture, a culture where facts (not opinions) play a crucial role in making business decisions. An articulated data equals insightful decisions.

Today we live in data culture, a culture where facts (not opinions) play a crucial role in making business decisions. An articulated data equals insightful decisions.
Every business collects data, but over time, data piles up making it hard to manage and derive sense out of it. That’s where business intelligence software like Microsoft Power BI comes in. Using Power BI data analytics makes it easier to collect, manage, and analyze the data for actionable insights.
As of now, Microsoft Power BI enjoys an 8.76% market share and is primarily used by companies having 50-200 employees and generating 10M – 15M USD in revenue.
What is Power BI?
Power BI is a collective name that bundles a range of cloud-based apps, software services, and connectors working in unison for collecting, managing, analyzing, and presenting data insights in a visually appealing manner. Power BI collects data from versatile sources, including excel sheets and data warehouses, allowing users to share clear and happening data using a friendly interface.
Power BI is an umbrella term referring to Power BI Desktop, Online SaaS service with the name Power BI Service, and Power BI mobile app available for iOS, Windows, and Android devices. In short, Power BI data analytics has everything and does anything related to data collection, fragmentation, analysis, and interpretation.
Why Do You Need Power BI for your Business?
Do you know, Power BI data analytics reveals actionable insights from your data pile, in not more than five minutes?
Microsoft Power BI is a suite of Business Intelligence, reporting, and data visualization products and services specifically designed for individuals and teams. The streamlined publications, distribution capabilities, and easy integration with other Microsoft products and services distinguish Power BI data analytics from the competition.
Microsoft Power Business Intelligence tool transforms all your data into easily understandable charts and graphs. Thus, instead of boring tables, numbers, and complex words, your data becomes colorful, easy to understand, and visually appealing. The insight stories told by the compelling reports ensure your decisions are always right and impacting.
In the recent Gartner Magic Quadrant on analytics and business intelligence (BI), Microsoft has once again emerged as a “Leader” quadrant by pushing key competitors down and left. This is 14th year in a row, Microsoft has become a leader in BI.
Top 10 Benefits of Choosing Power BI as Your Data Analytics Tool
1. Ease-of-Use:
Power BI data analytics offer an uncomplicated setup that evades the possibility of training the workforce that will be using it. The low-code platform and friendly user-interface ascertain, even a novice can pull reports like a true Power BI expert.
2. Real-Time Insights:
BI dashboards are updated in real-time whenever data is received. It allows businesses to identify gaps, find new opportunities, or solve problems quickly. All the displayed reports consider updated real-time data and visuals. Data sources differ from business-to-business, but time-sensitive data is collected and transmitted in real-time.
3. Works across multiple platforms and devices:
It does not matter whether you are in the office or on the move; you can always view the shared and updated insights and reports from your device from any location. Access and visualize the Power BI data analytics reports instantly on any iOS, Android, and Windows devices using native apps, provided there is internet connectivity.
4. Drag-and-Drop Functionality:
We also call it a low-code platform; it is easy to understand, seamless to operate, and requires no formal training. The low-code platform allows any staff member to generate reports of their choice without learning how to handle the tool. The drill-down (drop-down) feature under data visualization offers a comfortable and better understanding of what is going on around. Besides, the use of natural language queries bridges the necessity to learn complex query languages.
5. Seamless Connectivity:
Power BI data analytics supports multiple data sources, as if CRM captures sales data, ERP is for financial data, etc. With the BI, you can access on-premise, Azure cloud, and other third-party data sources using a single application. It allows users to come up with new and more holistic datasets using multiple or heterogeneous data sources.
6. Timely Updates:
Microsoft ensures Power BI’s development is in-line with the evolving technology; hence monthly updates keep it competitive and afresh. Every update adds new features or updates an existing feature based on customer feedback or user needs.
7. Ever Growing Community:
By the end of 2017, the Power BI online community had 5 million active subscribers and was used by 200,000 organizations. Over the past couple of years, the online Power BI community has grown significantly. The Power BI community is an online place for subscribers to share their ideas, provide feedback, and help fellow subscribers by answering or solving their queries. Additionally, developers and Power BI consulting companies using Power BI API can customize their visual reports and make them available for others by publishing them on GitHub.
8. Data Refresh:
Unlike other BI tools not supporting live querying, Power BI Pro allows the refreshing of data cache up to 8 times a day. Conversely, the Power BI Premium refreshes data cache up to 48 times a day. Thus, every time you pull a report, you see the latest version of your data. Seeking advice from a reputed Power BI consulting company will give you a fair idea about the difference in Power Bi Pro and Premium version. Moreover, they will also guide you about the best version to use.
9. Data Governance and Security
Microsoft Power BI data analytics manages security, user access, and security within the interface as per your locality. The built-in Azure Active Directory (AAD) allows only authenticated users to use the system via Single Sign-On (SSO), along with the user’s Power BI login credentials to get into the system. The security functions are embedded in every phase of Power BI Development. Security systems like NAT, IP filtering, and firewalls continually monitor Power BI productions to protect against distributed denial of service attacks.
10. Cost-Effectiveness:
Power BI is a subscription-based service; hence, it does not ask users to buy a license or support for accessing it. New customers can easily subscribe for a free version and start building customized dashboards. As of now, Power BI has two versions – Power BI Pro and Power BI Premium. The Pro version offers a low cost per user including complete functionality for Azure Cloud. On the other hand, the Premium version refreshes data 48 times and allows multiple users to use it from multiple locations at any given time. Please note, the Premium version is slightly expensive compared to the Pro Power BI version.
Conclusion
The speed, agility, and quality of the Business Intelligence system have the potential to either make or break the long-term success of a business using it. Microsoft has come at the forefront of Business Intelligence with its holistic Power BI data analytics tool due to its proven record of accomplishment and desire to unleash new horizons in technology. It collects, manages, and analyzes data for actionable insights, to discover useful information, suggesting conclusions, and enhance overall decision-making power.
Now, it’s your turn to unleash the mightiness of Power BI.
We are Microsoft Certified and market leaders in Power BI Consulting. Let our Power BI experts simplify and streamline your business data by automating the process of connecting and extracting data from sources and loading it into a destined place. Let us help you avail the benefits of using the Power BI data analytics tool.

Contact Us

  • break

Call For Your Free Consultation
1.866.667.1368