Microsoft Fabric Capacity Units (CUs) Explained: 2026 Sizing Guide
Complete guide to Microsoft Fabric Capacity Units. What CUs measure, how they map to F-SKUs, workload consumption rates, and the CU calculator every Fabric buyer needs.
Microsoft Fabric bills capacity by "Capacity Units" (CUs), a fabricated (pun intended) currency unit that measures compute consumption across every Fabric workload — Power BI, warehouses, lakehouses, notebooks, Data Factory pipelines, Real-Time Intelligence, and Copilot. If you are buying a Fabric F-SKU without understanding CUs, you are either overspending or heading for a throttling incident. This guide explains what CUs actually measure, how they map to F-SKUs, what each workload consumes, and provides a sizing framework backed by real enterprise benchmarks.
What Is a Capacity Unit (CU)?
A Capacity Unit is Microsoft's abstract unit of compute in Fabric. One CU is roughly equivalent to a specific amount of underlying compute resources — CPU seconds, memory allocation, and I/O operations — normalized across every Fabric workload. A CU is not a wall-clock second; it is a compute-second measured against Microsoft's internal capacity model.
The critical numbers to memorize:
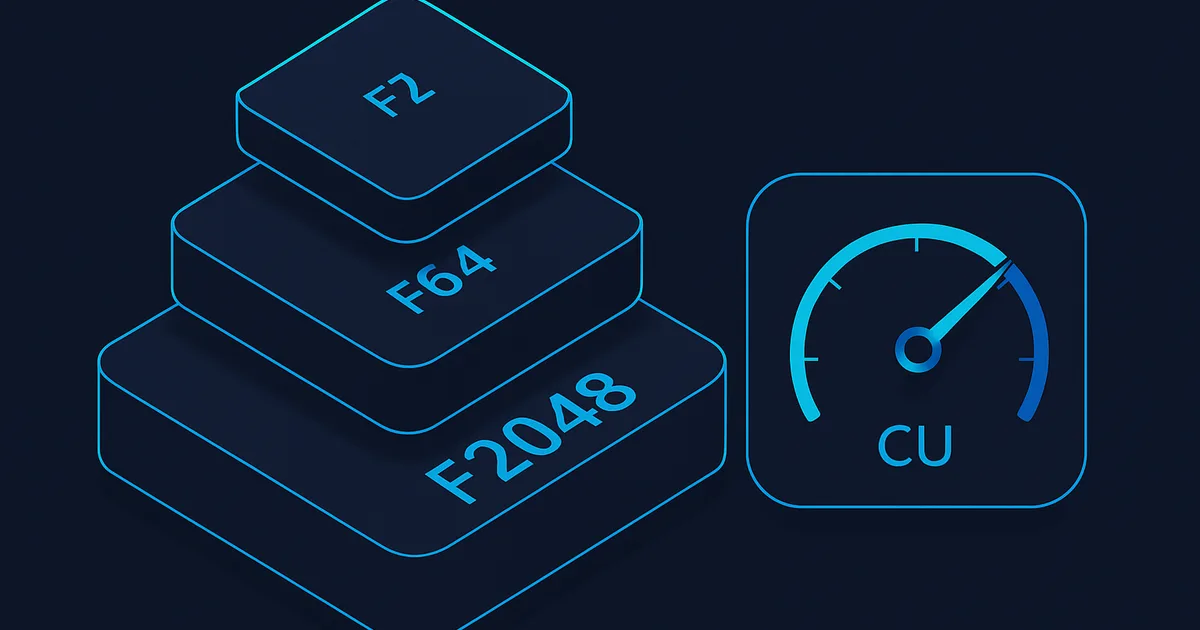
- F2 SKU = 2 CU of capacity available continuously (2 CU-seconds per second)
- F64 SKU = 64 CU — the pivot SKU that unlocks free Pro-viewer access
- F2048 SKU = 2048 CU — the top-tier enterprise SKU
Each F-SKU number equals its base CU allocation. So an F64 continuously provides 64 CU-seconds per second, or 64 × 3600 × 24 × 30 = ~166 million CU-seconds per month at full utilization. In practice, you never operate at 100% utilization — 60-70% average is a healthy target with 30% headroom for spikes.
How CUs Map to F-SKUs and Cost
The full 2026 US-list Fabric F-SKU catalog (pay-as-you-go per-month):
| SKU | CUs | Pay-as-you-go/mo | 1-year Reserved/mo | Free Pro viewers? |
|---|---|---|---|---|
| F2 | 2 | $262.80 | $156.34 | No |
| F4 | 4 | $525.60 | $312.69 | No |
| F8 | 8 | $1,051.20 | $625.37 | No |
| F16 | 16 | $2,102.40 | $1,250.74 | No |
| F32 | 32 | $4,204.80 | $2,501.49 | No |
| F64 | 64 | $8,409.60 | $5,002.67 | Yes ✓ |
| F128 | 128 | $16,819.20 | $10,005.34 | Yes |
| F256 | 256 | $33,638.40 | $20,010.67 | Yes |
| F512 | 512 | $67,276.80 | $40,021.34 | Yes |
| F1024 | 1024 | $134,553.60 | $80,042.69 | Yes |
| F2048 | 2048 | $269,107.20 | $160,085.38 | Yes |
Reserved capacity discounts are 40% for a 1-year commitment. If you know you need Fabric for at least 12 months, reserved capacity is always the correct choice — the discount is significant and there is no lock-in penalty at renewal.
What Each Fabric Workload Consumes in CUs
Approximate CU consumption per workload operation (2026 measured across enterprise deployments):
Power BI (Direct Lake / Direct Lake+ semantic model)
- Simple aggregation query: 0.05 - 0.15 CU-seconds per query
- Complex time-intelligence query: 0.20 - 0.50 CU-seconds
- Report page load (5 visuals): 0.5 - 1.5 CU-seconds
- Semantic model refresh (Import mode, 10 GB dataset): 200 - 400 CU-seconds
- Semantic model refresh (Direct Lake — no refresh needed): 0 CU
Power BI (Copilot in agent mode)
- Insights Agent invocation: 8 - 15 CU-seconds
- DAX Agent (measure generation): 12 - 20 CU-seconds
- Report Design Agent (page layout generation): 20 - 40 CU-seconds
- Data Model Agent (schema review): 10 - 18 CU-seconds
Fabric Warehouse
- Small query (< 1 GB scanned): 5 - 20 CU-seconds
- Medium query (1-10 GB scanned): 30 - 120 CU-seconds
- Large analytical query (100 GB scanned): 500 - 2000 CU-seconds
Fabric Lakehouse
- Spark SQL query on Delta table: 8 - 40 CU-seconds
- PySpark notebook cell execution (5-min job): 200 - 800 CU-seconds
- Autoloader Streaming ingest (per hour): 400 - 1200 CU-seconds
Real-Time Intelligence
- Eventstream ingest (per 1M events): 100 - 300 CU-seconds
- KQL query (small): 2 - 10 CU-seconds
- Real-Time Dashboard refresh: 5 - 20 CU-seconds per refresh interval
- Data Activator trigger evaluation (per 1000 events): 2 - 8 CU-seconds
Data Factory
- Pipeline execution (10 activities, medium data volume): 100 - 300 CU-seconds
- Dataflow Gen2 refresh (1 GB source): 200 - 500 CU-seconds
- Copy Data activity (10 GB): 60 - 180 CU-seconds
Fabric SQL Database
- OLTP transaction (single-row insert): 0.01 - 0.05 CU-seconds
- Point-lookup query: 0.02 - 0.10 CU-seconds
- Complex analytical query on OLTP schema: 30 - 120 CU-seconds
The 24-Hour Smoothing Window
Fabric implements a rolling 24-hour smoothing window. When you exceed your capacity's CU/second budget in a peak minute, Fabric borrows against the next 24 hours of budgeted CU. This is why occasional spikes do not immediately throttle you — the smoothing absorbs them. What throttles you is sustained consumption above capacity. If you consume 130% of your F64 (~83 CU/sec average) for hours, the smoothing exhausts and Fabric starts throttling (delaying operations or rejecting new requests).
Practical implication: buy a capacity such that your average load is 60-70% of capacity, and your peak hourly load stays under 130%. That balance keeps smoothing effective and avoids user-facing throttling incidents.
CU Sizing Framework by Workload Profile
Enterprise sizing by workload type (empirical guidance from real deployments):
Small BI-only workload (100-500 Pro-equivalent users)
- Power BI Import semantic models, moderate refresh frequency
- 20-50 reports, 1000-3000 report views/day
- Recommended: F32 to F64 ($4,200-$8,400/mo pay-as-you-go)
Medium BI + light data engineering (500-2000 users)
- Mix of Import and Direct Lake+ semantic models
- Fabric warehouse for one BI subject area, Bronze/Silver medallion in Lakehouse
- 50-150 reports, 5000-15000 report views/day
- Recommended: F64 to F128 ($8,400-$16,800/mo pay-as-you-go)
Enterprise BI + full data engineering + real-time (2000+ users)
- Full medallion Bronze/Silver/Gold, multiple Warehouses, Real-Time Intelligence
- Notebook workloads for data science
- Copilot enabled tenant-wide
- 200+ reports, 30000+ report views/day
- Recommended: F256 to F512 ($33K-$67K/mo pay-as-you-go)
Enterprise + Copilot-heavy + Data Agents in production
- All of the above, plus Fabric Data Agent API embedded in customer-facing apps
- Heavy Copilot agent-mode usage by BI teams
- Recommended: F512 to F1024 ($67K-$134K/mo pay-as-you-go)
The CU Calculator Framework
To estimate your CU consumption for a specific workload, use this formula:
Monthly CU-hours = Σ (operation_type × frequency × avg_CU-seconds ÷ 3600)
Example: 5,000 semantic model queries per day at 0.20 CU-seconds each: - Daily CU-seconds: 5,000 × 0.20 = 1,000 CU-seconds - Monthly CU-seconds: 1,000 × 30 = 30,000 CU-seconds - Monthly CU-hours: 30,000 / 3600 = ~8.3 CU-hours
Repeat for every workload type in your environment, sum, divide by 720 (hours per month) to get average CU/second consumption. That number should be under 60-70% of your F-SKU's capacity.
Where to Monitor CU Consumption
Capacity Metrics App: Microsoft ships the Capacity Metrics App (free, install from AppSource) that shows per-item CU consumption over rolling 14-day windows. This is the primary tool for capacity planning and throttling investigation. Key views:
- Overview — total CU % over time, highlighting spikes
- Per-item breakdown — which semantic models, warehouses, notebooks are the biggest consumers
- Throttling events — timeline of any throttling incidents with the responsible items
Fabric Admin center → Monitoring Hub (Build 2026 GA) — real-time capacity monitoring with drill-down to specific operations. This is the newer, more actionable interface.
Fabric admin log via Log Analytics — for programmatic monitoring and integration into your existing observability stack.
Common CU Sizing Mistakes
Mistake 1: Buying for peak, not average. F-SKU cost scales linearly with capacity — a doubled SKU costs 2x. Buy for the 70th percentile of your daily load, not the 99th percentile. Smoothing handles the spikes.
Mistake 2: Forgetting Copilot CU. Enabling Copilot tenant-wide without measuring usage can add 30-50% to CU consumption. Pilot Copilot with a limited user group first, measure the CU cost, then scale.
Mistake 3: Under-sizing for Direct Lake+. Direct Lake+ eliminates refresh CU but shifts consumption to query time. A workload with heavy report views may use more query-time CU than the equivalent Import-mode refresh — model this before migrating.
Mistake 4: Not using reserved capacity. 40% discount for 1-year commit is significant. Any workload with >12 months forward visibility should use reserved.
Mistake 5: Ignoring the 24-hour smoothing window. Some capacity planners size for peak-minute load; that is over-sizing. Fabric smoothing absorbs short spikes. Size for peak-hour or peak-15-min instead.
When to Move Up to the Next SKU
Signal to upgrade to the next F-SKU:
- Average CU utilization consistently > 75% for 2+ weeks
- Throttling events > 1 per week for the same time-of-day
- New workload coming online (e.g., adding Copilot, adding a new business unit) that projections show will push utilization over 80%
- Peak-hour utilization > 150% sustained (smoothing running dry)
Signal to downgrade to a smaller SKU:
- Average CU utilization < 30% for 30+ days
- Zero throttling events for 60+ days AND peak-hour utilization consistently < 60%
- Reserved capacity renewal coming up and current usage does not justify committed size
Related Guides
- Microsoft Fabric vs Power BI Premium: 2026 Break-Even Analysis
- Fabric Capacity Cost Optimization Playbook
- Fabric Copilot Cost Optimization: CU Consumption Guide
- Direct Lake+ Performance Benchmarks: Query Speed vs Import + DirectQuery
- Power BI Premium P1/P2/P3 to Fabric F-SKU Migration Runbook
- Fabric Real-Time Intelligence + Eventhouse Complete Guide
- Power BI Copilot Agent Mode: Enterprise Deep-Dive
- Microsoft Fabric Consulting Services
Ready to right-size your Fabric capacity? Book a 30-minute CU sizing review and we will model your specific workload against F-SKU cost.
Frequently Asked Questions
What are Microsoft Fabric Capacity Units (CUs)?
Capacity Units (CUs) are Microsoft Fabric's abstract unit of compute measurement. One CU represents a specific amount of underlying compute resources (CPU, memory, I/O) normalized across every Fabric workload — Power BI, warehouses, lakehouses, notebooks, Data Factory, Real-Time Intelligence, and Copilot. An F-SKU's number equals its base CU allocation: F2 = 2 CU, F64 = 64 CU, F2048 = 2048 CU. You are billed based on your F-SKU's CU allocation, not per-CU actual usage.
How many Capacity Units does an F64 Fabric SKU have?
An F64 Fabric SKU provides 64 CUs of capacity continuously — 64 CU-seconds per second. Over a full 30-day month at 100% utilization that is approximately 166 million CU-seconds. In practice, target 60-70% average utilization to leave 30% headroom for spikes. F64 pay-as-you-go costs $8,409.60/month; with 1-year reserved capacity, $5,002.67/month. F64 is the pivot SKU that unlocks unlimited free Power BI Pro viewers.
How do Fabric CUs work with the 24-hour smoothing window?
Fabric implements a rolling 24-hour smoothing window. When peak-minute consumption exceeds your capacity's CU/second budget, Fabric borrows CU from the next 24 hours of budgeted capacity, absorbing short spikes without throttling. Sustained consumption above capacity — say 130% for hours — exhausts the smoothing and triggers throttling (delayed operations or rejected requests). Size for average 60-70% of capacity and peak-hour under 130% to keep smoothing effective.
How many CUs does a typical Power BI report query consume?
A typical Power BI Direct Lake+ semantic model query consumes 0.05 to 0.15 CU-seconds for simple aggregations and 0.20 to 0.50 CU-seconds for complex time-intelligence queries. A full report page load (5 visuals) consumes 0.5 to 1.5 CU-seconds. Copilot invocations are much heavier: 8 to 20 CU-seconds per Insights Agent or DAX Agent call, and 20 to 40 CU-seconds for Report Design Agent page-layout generation.
How do I calculate how many CUs my Fabric workload will need?
Multiply (operation frequency × average CU-seconds per operation) for every workload type in your environment, sum them, and divide by 720 hours per month to get average CU/second consumption. That number should be under 60-70% of your F-SKU's capacity. Example: 5,000 semantic model queries/day at 0.20 CU-seconds each equals 1,000 CU-seconds/day, or approximately 8.3 CU-hours/month. Use the Capacity Metrics App to validate against actuals after go-live.
What Fabric F-SKU should I buy for a mid-size company?
For 500-2000 Power BI users with mixed Import and Direct Lake+ semantic models, one Fabric warehouse, medallion architecture (Bronze/Silver in Lakehouse), and 5000-15000 report views/day: choose F64 to F128 ($8,400-$16,800/month pay-as-you-go, or $5,000-$10,000/month with 1-year reserved). F64 is the pivot SKU that unlocks free Pro viewers; upgrade to F128 if Copilot is enabled tenant-wide or data engineering workloads are heavy.
How can I monitor Fabric Capacity Unit consumption?
Install the Microsoft Fabric Capacity Metrics App from AppSource — the primary tool for CU monitoring. It shows total CU % over rolling 14-day windows, per-item breakdown (which items are the biggest consumers), and throttling event timelines. For real-time monitoring, use the Fabric Admin center Monitoring Hub (Build 2026 GA). For programmatic monitoring, export the Fabric admin log to Log Analytics or a Fabric warehouse for SIEM integration.
When should I upgrade my Fabric F-SKU capacity?
Upgrade signals: average CU utilization consistently above 75% for 2+ weeks; throttling events more than 1 per week at the same time-of-day; a new workload coming online (Copilot rollout, new business unit) with projections showing utilization will exceed 80%; peak-hour utilization above 150% sustained (smoothing running dry). Conversely, downgrade signals: average utilization below 30% for 30+ days; zero throttling events for 60+ days with peak-hour below 60% consistently.