5 Rules to Fix Power BI Semantic Model Sprawl
Stop ungoverned Power BI dataset chaos. Use these 5 certification, versioning, and shared model strategies from Fortune 500 teams. Free checklist.
<h2>Power BI Semantic Models as Managed Data Products: The Enterprise Approach</h2>
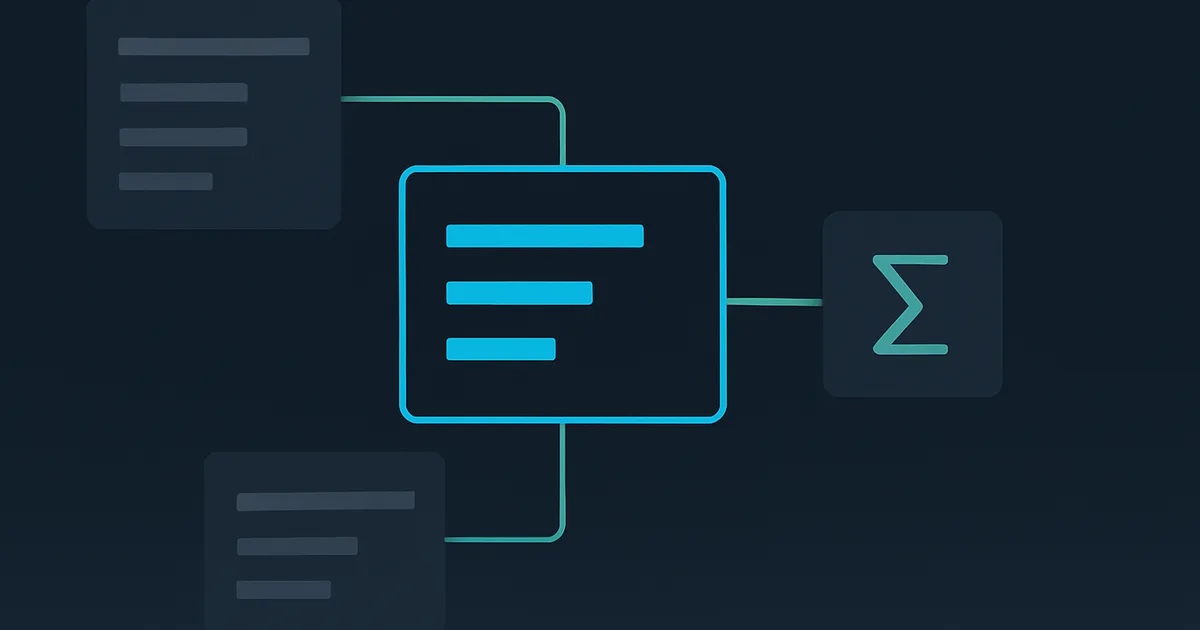
<p>The semantic model—formerly called a dataset—is the most critical layer of any Power BI deployment. It sits between raw data sources and the reports that business users consume daily. In organizations with hundreds of reports and thousands of users, the quality, governance, and management of semantic models determines whether Power BI is a strategic analytics platform or a chaotic spreadsheet replacement. <strong>Treating semantic models as managed data products</strong> means applying the same rigor to your Power BI data layer that product teams apply to customer-facing software: versioning, documentation, certification, quality testing, ownership, and lifecycle management. This guide provides the comprehensive best practices our <a href="/services/power-bi-consulting">Power BI consulting</a> teams implement at Fortune 500 organizations.</p>
<h2>The Semantic Model as a Data Product</h2>
<h3>What Is a Data Product?</h3>
<p>A data product is a dataset that is intentionally designed, documented, quality-tested, and maintained for consumption by other teams. It has a clear owner, a defined schema contract, versioning, and SLAs for freshness and availability. In the Power BI context, a semantic model becomes a data product when it moves beyond being an ad-hoc model built for a single report and becomes a <strong>shared, governed, certified artifact</strong> consumed by multiple reports and teams across the organization.</p>
<p>The distinction is critical. Most organizations start with report-first development: an analyst builds a report, creates a model to support it, publishes both together, and moves on. Over time, this produces dozens or hundreds of independent models with overlapping data, inconsistent business logic, and no governance. The data product approach inverts this pattern—the model is designed first, independently of any specific report, as a reusable analytical asset.</p>
<h3>Key Principles of Semantic Models as Data Products</h3>
<ul> <li><strong>Discoverability</strong> — Every semantic model must be findable through a centralized catalog (Power BI data hub, Microsoft Purview, or a custom metadata catalog). Users should be able to search for certified models by domain, business function, or data subject area.</li> <li><strong>Addressability</strong> — Each model has a unique, stable identifier and connection endpoint. Reports connect to semantic models through a well-known workspace and model name, and these identifiers do not change during routine updates.</li> <li><strong>Trustworthiness</strong> — Certified models carry an explicit quality guarantee: the data has been validated, business logic has been reviewed, refresh schedules are monitored, and a named owner is accountable for issues.</li> <li><strong>Self-describing</strong> — The model contains comprehensive metadata: measure descriptions, column descriptions, table descriptions, data source documentation, and business context. A user connecting to the model via <a href="/blog/power-bi-report-builder-complete-guide-2026">Report Builder</a> or Excel should understand every field without external documentation.</li> <li><strong>Interoperable</strong> — The model follows organizational standards for naming, formatting, and structure. Measures from different certified models can be composed in composite models without naming conflicts or ambiguity.</li> <li><strong>Secure by default</strong> — Row-level security (RLS), object-level security (OLS), and sensitivity labels are built into the model, not bolted on after deployment.</li> </ul>
<h2>Certification Workflow for Semantic Models</h2>
<h3>The Three-Tier Model</h3>
<p>Enterprise Power BI deployments should implement a three-tier certification model that provides clear signals to consumers about the trustworthiness of any given semantic model:</p>
<ol> <li><strong>Uncertified (Default)</strong> — Any model published to a workspace. No quality guarantees. Suitable for personal exploration and prototyping. These models should not be consumed by reports outside the author's immediate team.</li> <li><strong>Promoted</strong> — The model owner has promoted the model, indicating it is ready for broader team consumption. The model has basic documentation and a regular refresh schedule. Promotion is a self-service action available to workspace contributors.</li> <li><strong>Certified</strong> — A designated data steward or Center of Excellence (CoE) team has reviewed and certified the model. Certification requires passing a formal checklist covering data quality, business logic accuracy, documentation completeness, security configuration, and performance benchmarks. Certification is restricted to authorized users configured in the Power BI admin portal.</li> </ol>
<h3>Certification Checklist</h3>
<p>Before certifying a semantic model, the reviewing authority should verify the following:</p>
<table> <thead> <tr><th>Category</th><th>Requirement</th><th>Verification Method</th></tr> </thead> <tbody> <tr><td>Data Quality</td><td>All tables load without errors</td><td>Check refresh history for 30 days</td></tr> <tr><td>Data Quality</td><td>Row counts match source system</td><td>Compare model row counts to source queries</td></tr> <tr><td>Business Logic</td><td>Key measures validated against source of truth</td><td>Cross-check 10 critical measures with finance/ops</td></tr> <tr><td>Business Logic</td><td>DAX patterns follow organizational standards</td><td>DAX code review using Best Practice Analyzer</td></tr> <tr><td>Documentation</td><td>All measures have descriptions</td><td>Tabular Editor metadata audit</td></tr> <tr><td>Documentation</td><td>All visible columns have descriptions</td><td>Tabular Editor metadata audit</td></tr> <tr><td>Documentation</td><td>Model has a README or wiki page</td><td>Check linked documentation</td></tr> <tr><td>Security</td><td>RLS roles defined and tested</td><td>Test with DAX Studio or "View as" feature</td></tr> <tr><td>Security</td><td>Sensitivity labels applied</td><td>Check model properties in Power BI Service</td></tr> <tr><td>Performance</td><td>No single query exceeds 5 seconds</td><td>DAX Studio server timings on representative queries</td></tr> <tr><td>Performance</td><td>Model size within capacity limits</td><td>Check model size in workspace storage</td></tr> <tr><td>Refresh</td><td>Incremental refresh configured (if applicable)</td><td>Check refresh policy in model settings</td></tr> <tr><td>Refresh</td><td>Refresh duration within SLA</td><td>Check refresh history duration trend</td></tr> <tr><td>Ownership</td><td>Named owner and backup owner assigned</td><td>Verify in model metadata or governance tool</td></tr> </tbody> </table>
<h2>Shared Datasets Strategy: Thin Reports vs. Thick Reports</h2>
<h3>The Architecture Decision</h3>
<p>The single most impactful architectural decision in enterprise Power BI is whether reports should contain their own data models (thick reports) or connect to shared semantic models in separate workspaces (thin reports). The answer for enterprise deployments is almost always: <strong>use thin reports connected to shared certified semantic models</strong>.</p>
<p><strong>Thick Reports (Report + Model Together):</strong></p> <ul> <li>The .pbix file contains both the data model and report visuals</li> <li>Each report maintains its own copy of the data and business logic</li> <li>Changes to business logic must be replicated across every report that contains similar calculations</li> <li>Suitable for personal analytics, proof-of-concepts, and isolated use cases</li> <li>Not suitable for enterprise-scale deployments with shared business definitions</li> </ul>
<p><strong>Thin Reports (Report Connected to Shared Model via Live Connection):</strong></p> <ul> <li>The report .pbix file contains only visuals and page layout—no data model</li> <li>The report connects to a published semantic model via live connection</li> <li>Business logic (measures, relationships, hierarchies) is defined once in the shared model</li> <li>Multiple reports share the same semantic model, guaranteeing consistent business definitions</li> <li>Model changes propagate to all connected reports automatically</li> <li>This is the recommended pattern for enterprise deployments and is the foundation of the <a href="/services/power-bi-architecture">Power BI architecture</a> approach we implement</li> </ul>
<h3>Workspace Strategy for Shared Models</h3>
<p>Separate your semantic models and reports into different workspaces to enable independent lifecycle management:</p>
<ul> <li><strong>Model Workspaces</strong> — Contain only semantic models (datasets). Naming convention: `[Domain] - Models` (e.g., "Finance - Models", "Sales - Models"). Access is restricted to model developers and the CoE team. These workspaces are backed by Premium or Fabric capacity to enable features like XMLA endpoints and large model support.</li> <li><strong>Report Workspaces</strong> — Contain only thin reports connected to models in Model Workspaces. Naming convention: `[Domain] - Reports` (e.g., "Finance - Reports", "Sales - Reports"). Report developers have contributor access. Business users access reports through the Power BI app published from these workspaces.</li> <li><strong>Sandbox Workspaces</strong> — For exploratory analysis and prototyping. Individual or team sandboxes where thick reports are acceptable. Models developed here are migrated to Model Workspaces through the certification workflow before broader consumption.</li> </ul>
<h2>Composite Models: Extending Shared Datasets</h2>
<h3>When to Use Composite Models</h3>
<p>Composite models allow report developers to extend a shared semantic model with additional local data without modifying the original certified model. This is a critical capability for balancing governance with flexibility.</p>
<p><strong>Common composite model scenarios:</strong></p> <ul> <li><strong>Departmental enrichment</strong> — The certified Sales model contains CRM pipeline data, but the marketing team needs to add campaign performance data from their marketing platform. A composite model lets marketing add their tables on top of the shared Sales model.</li> <li><strong>Budget and target overlays</strong> — Finance publishes a certified Actuals model. Business units add their budget/target tables as local additions to create actual-vs-budget comparisons without modifying the certified Actuals model.</li> <li><strong>Cross-domain analysis</strong> — A composite model combines the certified Finance model with the certified HR model to analyze revenue per employee or cost-per-hire metrics, without creating a new monolithic model.</li> <li><strong>Aggregation layers</strong> — Add pre-aggregated tables over a DirectQuery model to improve query performance for common analytical patterns, using Power BI's aggregation detection to route queries to the optimal table.</li> </ul>
<h3>Composite Model Governance Rules</h3>
<p>While composite models provide flexibility, they introduce governance considerations that must be managed:</p> <ul> <li>Local tables added to a composite model are not subject to the certification of the base model. Make this clear to consumers.</li> <li>Establish naming conventions that distinguish local measures from base model measures (e.g., prefix local measures with the department name).</li> <li>Composite models that prove broadly useful should be candidates for promotion to full certified models, with the local data integrated into the base model or a new certified model.</li> <li>Monitor composite model proliferation—if many teams are adding the same local data, that data should be incorporated into the certified model.</li> </ul>
<h2>Model Optimization Best Practices</h2>
<h3>Star Schema Design</h3>
<p>Every certified semantic model should follow star schema design principles. This is not optional for enterprise deployments—it directly determines query performance, measure complexity, and user comprehension:</p>
<ul> <li><strong>Fact tables</strong> contain numeric measures and foreign keys to dimension tables. They are narrow (few columns) and tall (many rows). Example: FactSales with columns SalesAmount, Quantity, DateKey, ProductKey, CustomerKey.</li> <li><strong>Dimension tables</strong> contain descriptive attributes for filtering and grouping. They are wide (many columns) and short (fewer rows). Example: DimProduct with columns ProductName, Category, Subcategory, Brand, Color, LaunchDate.</li> <li><strong>Relationships</strong> flow from dimension (one side) to fact (many side). All relationships are single-direction by default. Bidirectional relationships are used only when specifically required (and documented with a comment explaining why).</li> <li>Avoid snowflake schemas (dimension tables joined to other dimension tables) in Power BI—flatten dimensions during ETL for optimal VertiPaq compression and query performance.</li> </ul>
<h3>Column and Table Optimization</h3>
<p>VertiPaq compression is column-based, and model size is determined primarily by the number and cardinality of columns:</p>
<ul> <li><strong>Remove unused columns</strong> — If a column is not used in any measure, relationship, filter, or visual, remove it from the model. Every column consumes memory, even if hidden. Use <a href="/blog/power-bi-performance-optimization">VertiPaq Analyzer</a> to identify unused columns.</li> <li><strong>Reduce column cardinality</strong> — High-cardinality columns (many unique values) compress poorly. Replace high-cardinality text columns with integer keys. Truncate timestamps to the required precision (date only vs. datetime). Round decimal values to the required precision.</li> <li><strong>Use integer keys for relationships</strong> — Integer keys compress dramatically better than text keys and produce faster relationship traversal. If your source uses text-based natural keys (like product codes), create integer surrogate keys during ETL.</li> <li><strong>Disable Auto Date/Time</strong> — Power BI's auto date/time feature creates a hidden calendar table for every date column. In models with many date columns, this can significantly inflate model size. Disable it and create a single shared Date dimension table instead.</li> <li><strong>Avoid calculated columns</strong> — Calculated columns are computed during refresh and stored in the model, consuming the same memory as imported columns. Replace calculated columns with measures (computed at query time) whenever possible. When a calculated column is truly needed (for sorting, filtering, or as a relationship key), document why a measure could not be used.</li> </ul>
<h3>Measure Organization</h3>
<p>Organize measures systematically to improve discoverability and maintainability in large models:</p>
<ul> <li><strong>Dedicated measure tables</strong> — Create empty tables (using `_Measures = {BLANK()}` or similar) to organize measures by business domain. Example tables: "_Sales Measures", "_Finance Measures", "_HR Measures". This prevents measures from being scattered across fact and dimension tables.</li> <li><strong>Display folders</strong> — Within measure tables, use display folders to create a hierarchy: "Revenue / Actuals", "Revenue / Budget", "Revenue / Variance". Display folders are configured through Tabular Editor or the XMLA endpoint.</li> <li><strong>Naming conventions</strong> — Adopt consistent naming: "Total Sales" (aggregation), "Sales YoY %" (time intelligence with percentage), "Avg Order Value" (average), "Sales MTD" (period-to-date). Avoid abbreviations that are not universally understood.</li> <li><strong>Measure descriptions</strong> — Every measure must have a description that explains what it calculates, the business definition, any filters or assumptions, and the data source. Example: "Total Revenue: Sum of all completed order amounts excluding returns and cancellations. Source: FactOrders where OrderStatus = 'Completed'."</li> <li><strong>Base measures and derived measures</strong> — Define base measures for fundamental aggregations (SUM, COUNT, AVERAGE) and build derived measures on top of base measures rather than re-aggregating raw columns. This creates a clear dependency chain: if the definition of "Total Sales" changes, all derived measures (Sales YoY, Sales MTD, Sales per Customer) automatically update.</li> </ul>
<h2>Naming Conventions</h2>
<h3>Model-Level Naming Standards</h3>
<p>Consistent naming across all certified models is essential for an enterprise deployment. Our <a href="/services/power-bi-consulting">Power BI consulting</a> engagements always establish a naming standard document as a prerequisite for model certification:</p>
<table> <thead> <tr><th>Element</th><th>Convention</th><th>Example</th></tr> </thead> <tbody> <tr><td>Semantic model name</td><td>[Domain] - [Subject Area]</td><td>Finance - General Ledger</td></tr> <tr><td>Fact tables</td><td>Fact [Subject]</td><td>Fact Sales, Fact Inventory</td></tr> <tr><td>Dimension tables</td><td>Dim [Entity]</td><td>Dim Customer, Dim Product</td></tr> <tr><td>Date dimension</td><td>Date (singular, no prefix)</td><td>Date</td></tr> <tr><td>Measure tables</td><td>_ [Domain] Measures</td><td>_Sales Measures</td></tr> <tr><td>Measures</td><td>Plain English, Title Case</td><td>Total Revenue, Gross Margin %</td></tr> <tr><td>Columns</td><td>Plain English, Title Case, spaces</td><td>Customer Name, Order Date</td></tr> <tr><td>Key columns (hidden)</td><td>[Entity]Key (PascalCase, no spaces)</td><td>ProductKey, CustomerKey</td></tr> <tr><td>Calculated tables</td><td>_ prefix (sorted to top)</td><td>_DateTable, _Measures</td></tr> <tr><td>Hierarchies</td><td>[Entity] Hierarchy</td><td>Product Hierarchy, Geography Hierarchy</td></tr> <tr><td>RLS roles</td><td>[Entity] - [Scope]</td><td>Region - North America</td></tr> </tbody> </table>
<h2>Versioning and Change Management</h2>
<h3>Version Control with Git Integration</h3>
<p>Power BI's Git integration (available with Fabric workspaces) enables version control for semantic models:</p>
<ul> <li><strong>Connect your Model Workspace to an Azure DevOps Git repository</strong>. Each semantic model is serialized into a folder of JSON files representing the model metadata (tables, columns, measures, relationships, expressions).</li> <li><strong>Branch strategy</strong> — Use a standard branching model: `main` branch represents production, feature branches for model changes, pull requests for review and approval before merging to `main`.</li> <li><strong>Change tracking</strong> — Every change to a certified model is captured as a Git commit, providing a complete audit trail of who changed what, when, and why.</li> <li><strong>Deployment pipelines</strong> — Use Power BI deployment pipelines (Development → Test → Production) to promote model changes through environments. Changes are tested in Development, validated in Test (with production-like data), and deployed to Production only after approval.</li> <li><strong>Rollback</strong> — If a model change causes issues in Production, revert to the previous Git commit and redeploy. This is dramatically safer than manual model editing in the Power BI Service.</li> </ul>
<h3>Semantic Versioning for Breaking Changes</h3>
<p>When a model change could break downstream reports (removing a measure, renaming a column, changing a relationship), communicate the change formally:</p>
<ol> <li><strong>Announce the change</strong> — Notify all report owners connected to the model, with the specific change details and timeline.</li> <li><strong>Deprecation period</strong> — Mark the old element as deprecated (add "[Deprecated]" to the description) and create the new element alongside it. Give consumers a defined migration period (typically 2-4 weeks).</li> <li><strong>Remove after migration</strong> — Only remove the deprecated element after confirming all downstream reports have migrated to the new element.</li> <li><strong>Document in changelog</strong> — Maintain a changelog for each certified model listing all breaking and non-breaking changes with dates.</li> </ol>
<h2>Documentation Standards</h2>
<h3>Model Documentation Requirements</h3>
<p>Every certified semantic model must have documentation at three levels:</p>
<ol> <li><strong>Model-level documentation</strong> — A wiki page or README covering: purpose and scope, data sources and refresh schedule, key business definitions, known limitations, owner and contact information, and version history.</li> <li><strong>Object-level documentation</strong> — Descriptions on every visible table, column, measure, and hierarchy within the model itself (accessible through the Tabular Object Model). Users browsing the model in Power BI Desktop, Excel, or Report Builder should be able to understand every element from its description alone.</li> <li><strong>Lineage documentation</strong> — Data lineage from source system to model, showing transformations applied at each stage. <a href="/blog/microsoft-fabric-notebooks-pyspark-data-engineering-2026">Microsoft Fabric's lineage view</a> and Purview provide automated lineage tracking, supplemented by manual documentation for complex transformation logic.</li> </ol>
<h3>Automated Documentation with Tabular Editor</h3>
<p>Tabular Editor (the open-source or commercial version) is the essential tool for enterprise semantic model management. Key documentation workflows:</p>
<ul> <li><strong>Best Practice Analyzer (BPA)</strong> — Run BPA rules that check for missing descriptions, naming convention violations, and anti-patterns. Integrate BPA checks into your CI/CD pipeline so models with documentation gaps cannot be deployed to production.</li> <li><strong>Bulk metadata editing</strong> — Update descriptions, display folders, and formatting across hundreds of objects using Tabular Editor's scripting capability (C# scripts that manipulate the Tabular Object Model).</li> <li><strong>Export model documentation</strong> — Generate documentation artifacts (markdown, HTML, or PDF) from model metadata using Tabular Editor scripts or third-party tools like Data Documentor.</li> </ul>
<h2>Performance Testing and Monitoring</h2>
<h3>Pre-Certification Performance Testing</h3>
<p>Before certifying a model, run performance tests using DAX Studio:</p>
<ul> <li><strong>Server Timings</strong> — Enable server timings and run representative DAX queries (the queries generated by your most-used report visuals). Capture Storage Engine (SE) time, Formula Engine (FE) time, and total duration.</li> <li><strong>Benchmarks</strong> — Establish performance benchmarks: no single query should exceed 3-5 seconds; average query time should be under 1 second; storage engine parallelism should show multiple SE queries for complex calculations.</li> <li><strong>Cold cache testing</strong> — Clear the model cache (`CALL [XMLA].ClearCache()` or restart the Analysis Services engine) and test query performance from cold cache to simulate first-user experience after a capacity restart.</li> <li><strong>Concurrency testing</strong> — Use tools to simulate multiple concurrent users querying the model simultaneously to validate that performance holds under load.</li> </ul>
<h3>Ongoing Monitoring</h3>
<p>After certification, monitor model health continuously:</p>
<ul> <li><strong>Refresh monitoring</strong> — Track refresh duration, success/failure rate, and data volume trends. Set up alerts for refresh failures using Power Automate or the <a href="/blog/power-bi-tenant-settings-admin-portal-governance-2026">Power BI admin monitoring</a> solution.</li> <li><strong>Query performance monitoring</strong> — Use the Fabric capacity metrics app to monitor query durations, queue times, and throttling events for your semantic models.</li> <li><strong>Model size trends</strong> — Track model size over time. Unexpected growth may indicate data quality issues (duplicate records), missing incremental refresh configuration, or upstream schema changes adding high-cardinality columns.</li> <li><strong>Usage analytics</strong> — Monitor which reports and users connect to each certified model. Low-usage models may be candidates for retirement. High-usage models may need performance optimization or migration to a larger capacity.</li> </ul>
<h2>Implementing the Data Product Approach: A Phased Roadmap</h2>
<h3>Phase 1: Inventory and Assessment (Weeks 1-2)</h3> <ul> <li>Catalog all existing semantic models using the Power BI REST API scanner endpoints</li> <li>Identify overlapping models (multiple models pulling from the same data sources with similar measures)</li> <li>Map model-to-report connections to understand the dependency graph</li> <li>Identify candidate models for certification (high usage, broad consumption, critical business metrics)</li> </ul>
<h3>Phase 2: Standards and Governance (Weeks 3-4)</h3> <ul> <li>Publish naming conventions, documentation standards, and certification checklist</li> <li>Configure Power BI admin portal: restrict certification to authorized users, enable endorsement settings</li> <li>Set up Model Workspaces with appropriate capacity and access controls</li> <li>Deploy Tabular Editor BPA ruleset and train model developers</li> </ul>
<h3>Phase 3: Model Consolidation (Weeks 5-8)</h3> <ul> <li>Consolidate overlapping models into domain-specific certified models</li> <li>Migrate thick reports to thin reports connected to new certified models</li> <li>Implement composite models where departmental extensions are needed</li> <li>Configure deployment pipelines for model lifecycle management</li> </ul>
<h3>Phase 4: Continuous Improvement (Ongoing)</h3> <ul> <li>Monthly certification reviews for existing certified models</li> <li>Quarterly model performance audits</li> <li>New model certification requests processed through CoE intake</li> <li>Regular training sessions for model developers on standards and tools</li> </ul>
<p><a href="/contact">Contact Power BI Consulting</a> for a semantic model maturity assessment. Our <a href="/services/power-bi-consulting">Power BI consulting</a> and <a href="/services/data-analytics">data analytics</a> teams help enterprises transform scattered Power BI datasets into a managed portfolio of certified data products—with governance, documentation, performance optimization, and organizational change management built into the engagement.</p>
Frequently Asked Questions
What is the difference between a promoted and certified semantic model in Power BI?
Promoted and certified are two levels of endorsement for Power BI semantic models. Promotion is a self-service action that any workspace contributor can perform on their own models—it signals that the model is ready for broader consumption but carries no formal quality guarantee. Certification is a restricted action that only designated users (configured in the Power BI admin portal) can perform, typically members of a Center of Excellence or data governance team. Certification signals that the model has passed a formal review covering data quality, business logic accuracy, documentation, security, and performance. In the Power BI data hub, certified models display a gold badge while promoted models display a blue badge, helping users quickly identify the most trustworthy data sources. Enterprise organizations should restrict the certified endorsement to models that have passed their full certification checklist and designate specific individuals or groups (not broad roles) as authorized certifiers.
Should I use thin reports or thick reports in an enterprise Power BI deployment?
For enterprise deployments, thin reports (reports connected to shared semantic models via live connection) are strongly recommended over thick reports (reports with embedded data models). Thin reports ensure consistent business definitions across all reports consuming the same model, eliminate duplicate data storage and refresh processing, and enable centralized model governance. When a measure definition changes in the shared model, all connected thin reports automatically reflect the update. Thick reports are appropriate for personal exploration, prototyping, and isolated use cases where the data and logic are unique to a single report. The transition from thick to thin reports requires investment in shared model development, but the long-term benefits in governance, consistency, and reduced maintenance are substantial. Most Fortune 500 Power BI deployments we implement use thin reports for 80-90% of production reporting, with thick reports reserved for sandboxes and specialized analytical workbooks.
How should I organize measures in a large Power BI semantic model?
In large models with hundreds of measures, organization is essential for maintainability and user experience. First, create dedicated measure tables (empty tables created with an expression like BLANK()) named with a leading underscore for sorting (e.g., _Sales Measures, _Finance Measures). This prevents measures from being scattered across fact and dimension tables in the field list. Second, within each measure table, use display folders to create a logical hierarchy (Revenue > Actuals, Revenue > Budget, Revenue > Variance). Display folders are configured through Tabular Editor or the XMLA endpoint. Third, adopt consistent naming conventions using plain English and Title Case (Total Revenue, Gross Margin %, Sales YoY Change). Fourth, add descriptions to every measure explaining the business definition, calculation logic, and any filters or assumptions. Fifth, structure measures as base measures (fundamental aggregations like SUM, COUNT) with derived measures built on top of base measures rather than re-aggregating raw columns. This creates a clear dependency chain where changing a base measure automatically propagates to all derived calculations.
What is the role of composite models in a shared dataset strategy?
Composite models enable a critical balance between central governance and departmental flexibility. A composite model extends a shared certified semantic model by adding local tables and measures without modifying the original model. This solves a common problem: the centralized certified model covers 80% of a department's needs, but the remaining 20% requires departmental data (budgets, targets, supplementary metrics) that does not belong in the enterprise model. With composite models, the department connects to the certified model as a DirectQuery source and adds their local Import tables on top, creating relationships between local and remote tables. The department gets a complete analytical view while the certified model remains unchanged and governed. Governance teams should monitor composite model proliferation—if multiple departments add the same local data, that data should be incorporated into the certified base model. Composite models that prove broadly useful should be candidates for promotion to full certified models.
How do I implement version control for Power BI semantic models?
Power BI Git integration (available with Fabric workspaces) enables native version control for semantic models. Connect your model workspace to an Azure DevOps Git repository, and each semantic model is serialized into JSON files representing model metadata (tables, columns, measures, relationships, M expressions). Use a standard branching model: the main branch represents production, feature branches for model changes, and pull requests for peer review before merging. Every change becomes a Git commit with a complete audit trail. For deployment, use Power BI deployment pipelines (Development to Test to Production) to promote changes through environments with validation at each stage. If a production deployment causes issues, revert to the previous Git commit and redeploy. For organizations not yet on Fabric, an alternative approach uses Tabular Editor to save model metadata as a Model.bim file (or TMDL folder structure) in Git, with CI/CD pipelines deploying through the XMLA endpoint. Both approaches provide change tracking, peer review, and rollback capabilities that are essential for managing certified data products.
What is a Power BI semantic model?
A Power BI semantic model (formerly called a dataset) is the data model published to the Power BI Service. It contains tables and relationships (typically star schema), DAX measures for business calculations, hierarchies for drill-down navigation, and row-level security rules. Semantic models sit between raw data sources and interactive reports, providing a single source of truth: multiple reports and dashboards connect to one semantic model via Live Connection, ensuring consistent metrics across the organization. Semantic models support four storage modes — Import, DirectQuery, Direct Lake / Direct Lake+, and Composite — chosen based on data freshness and volume requirements.
What are semantic models in Power BI?
Semantic models in Power BI are the governed data layer that provides business meaning and structure to raw data. Each semantic model contains: tables mapped to source data, defined relationships between tables (star schema recommended), DAX measures encoding business logic (revenue calculations, YoY comparisons, KPIs), hierarchies for drill-down analysis, and security rules (row-level or object-level). Semantic models are the shared foundation that multiple reports build on — updating a measure in the model updates every report that uses it, ensuring metric consistency. Best practice: publish shared certified semantic models rather than embedding a separate model in every report.
What is the Power BI semantic layer?
The Power BI semantic layer is the abstraction between raw data sources and analytical reports. It is comprised of the semantic model itself (tables, relationships, DAX measures, hierarchies, security), the DAX query engine that executes calculations, and the metadata catalog that describes measures and columns to end users. The semantic layer is what makes self-service BI possible — analysts can build reports against curated business metrics without needing to write SQL against complex source-system schemas. Well-designed semantic layers use shared certified models to enforce metric consistency across the organization, avoiding the "every report has its own calculation" fragmentation.